So how risky are investment companies?
Nick Britton compares the historical volatility and risk of investment companies and open-ended funds.
 It’s a common belief that investments that have higher historical volatility are more risky. While not everyone is totally convinced by this theory, let’s take it as read for the purposes of this post.
It’s another common belief that investment company returns are more volatile than those of open-ended funds. There are two good reasons why that should be the case: discounts often widen when markets fall (the infamous ‘double whammy’) and gearing acts as a magnifier of both positive and negative returns.
A glance at actual standard deviation figures over the past ten years seems to confirm the idea that investment companies are more volatile than equivalent open-ended funds, with a couple of exceptions:
|
AIC sector (investment companies) |
Annualised monthly standard deviation |
IA sector (open-ended funds) |
Annualised monthly standard deviation |
|---|---|---|---|
|
Asia Pacific - Excluding Japan |
24.02 |
Asia Pacific Excluding Japan |
22.33 |
|
Europe |
21.39 |
Europe Including UK |
16.02 |
|
Global |
17.92 |
Global |
18.22 |
|
Global Emerging Markets |
24.82 |
Global Emerging Markets |
23.73 |
|
Global Equity Income |
15.44 |
Global Equity Income |
17.46 |
|
Japan |
23.09 |
Japan |
20.93 |
|
UK All Companies |
19.80 |
UK All Companies |
15.40 |
|
UK Equity Income |
17.02 |
UK Equity Income |
13.66 |
|
UK Smaller Companies |
23.54 |
UK Smaller Companies |
16.56 |
Unweighted averages, based on share price total return. Source: AIC using Morningstar, to 31/1/16
But a cleaner way to compare the volatility of the two vehicles is to look at pairs of ‘sister funds’ – investment companies and OEICs run by the same manager. A recent piece of research from Canaccord Genuity identified 33 pairs of such funds, assessing their performance over the five years to 31 December 2015.
Of the 32 fund pairs for which I have data over the same five-year period, investment companies were more volatile in 27 cases. Across all 32 pairs, investment companies’ annualised standard deviation was, on average, 2.28 percentage points higher than the open-ended funds’ (based on share price total return). Not completely insignificant, but nor is it the stuff of nightmares. More to the point, the Canaccord Genuity research concluded the investment companies had significantly outperformed their sister OEICs and unit trusts over the past five years on an NAV basis – and in case you’re wondering, the same is true on a share price basis.
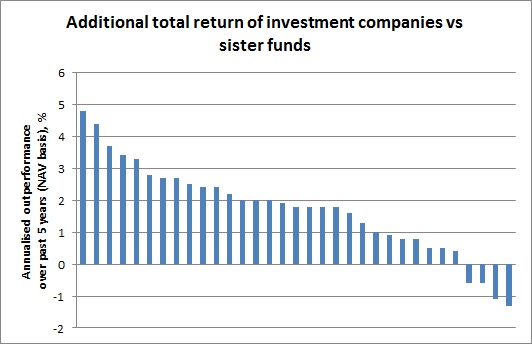 |
Source: Canaccord Genuity (to 31/12/15)
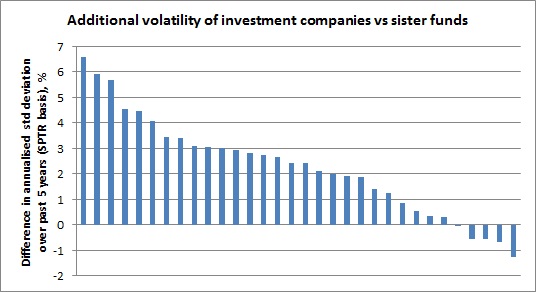 |
Source: AIC using Morningstar (to 31/12/15)
Interestingly, if you compare the volatility of the NAV total return (that is, the investment companies’ underlying performance, regardless of the discount or premium), the extra volatility of the investment company falls to an average of 0.57 percentage points across the 32 funds. This suggests that discounts and premiums are the chief reason that investment companies are more volatile than open-ended funds, rather than gearing, for example.
It’s worth outlining the reasons that investment companies may not be quite as volatile beasts as people think.
First, discounts. Yes, there is a tendency for discounts to widen as markets fall (and vice versa) but it doesn’t always happen this way. During the credit crunch and subsequent recovery, there was a very strong correlation between the average investment company discount and the wider stock market. But go back to the dot-com boom and bust and the correlation was virtually zero. The average discount across the industry is currently 7%, a pretty narrow level historically; yet we’ve entered an equity bear market. The contribution of discounts and premiums to volatility has also been reined in by the increasing tendency of boards to actively manage discount levels.
Then there’s gearing, widely seen as a contributor to risk, and not unreasonably. But it’s fairly lightly deployed among investment companies – over half of them have no gearing at all, and the average level across the industry was 8% as of 31 December 2015. That means an extra 0.8% percentage move for every 10% move in the market, up or down: nothing to panic about.
There is one other factor that may serve to dampen investment companies’ volatility, at least on paper. They can invest in less liquid assets – shares in unquoted companies, for example. Such assets tend to be valued less frequently – and so superficially, are less volatile (though that clearly does not mean they are less risky!)
So am I saying it’s a myth that investment companies are more volatile than open-ended funds? Absolutely not. It can’t be denied that investment companies have more potential for volatility built into the structure. The prospect of a perfect storm of falling NAVs and widening discounts as we saw in 2008 shouldn’t be forgotten.
But this is hardly a reason to rule out investment companies as part of a long-term portfolio. It’s the suitability for the client that is the crucial thing.
Certainly, there will be individuals for whom day-to-day volatility is a key concern. But there will be others who set a higher priority on growing wealth over time than limiting the bumpiness of returns from month to month. For these individuals, an allocation to investment companies makes perfect sense – as the latest analysis from Canaccord Genuity amply demonstrates.

Nick Britton
Nick is the AIC’s Research and Content Director. He is in charge of research projects at the AIC, working within the communications team and liaising closely with journalists, financial advisers and wealth managers. Nick holds the Investment Management Certificate and is an associate member of the Chartered Institute for Securities and Investment (CISI).
Email: [email protected]